Remote Debugging Snaps C++
Overview
This document describes how applications can be debugged if they are running in the confined Ubuntu Core snap environment of a ctrlX CORE (Remote Debugging).
In this document first is briefly described how ctrlX CORE instances are connected over TCP/IP and SSH.
Then each following chapter describes for one programming language the language-dependent features of snap debugging.
Connecting ctrlX CORE devices
IP Address of a ctrlX CORE
From the build environment ctrlX CORE devices are connected via TCP/IP. Assuming we are using a (QEMU) virtual machine as build environment the different kind of ctrlX CORE devices are reachable over these IP addresses:
- ctrlX COREvirtual with port forwarding: 10.0.2.2
- ctrlX COREvirtual with network adapter: 192.168.1.1
- ctrlX CORE: real IP address
To point 1.: From the point of view of the virtual machine this is the IP address of the host computer. The ctrlX COREvirtual has no own IP address. The connections to the control are realized via port forwarding.
Set up SSH Public Key Authentication
Debugging is based on SSH, so SSH should be set up between the debugger client on the host computer and the debugger server on the ctrlX CORE. To make logging in easier public key authentification should be installed.
For this kind of authorization a private / public key pair is generated. The private key is stored into a file kept secret on your host computer. The content of the public key is appended to the file ~/.ssh/authorized_keys in your home directory of the ctrlX CORE (remote computer).
Important
You need an account with root rights and a home directory on the ctrlX CORE.
Creating the key pair and the installation both on the host computer and on the ctrlX CORE (remote computer) is described here
Set up SSH public key authentication to connect to a remote system
or here (in German)
OpenSSH Public Key Authentifizierung unter Ubuntu.
Additional hints:
- Use standard file names: "id_rsa" for the private and "id_rsa.pub" for the public key file.
- On the host computer set the (UNIX) permissions attributes for "id_rsa" to 600 (-rw-------)
- On the host computer use the file "~/.ssh/config" to configure several ssh connections to different ctrlX CORE devices.
Remote Debugging C++
Introduction
Debugging C++ applications in their snap environment is done by two debugging tools:
- The gdb server is running on the remote target. During a debug session he will attach to the running process to be debugged.
- The gdb debugger is running on the build environment. At the start of a remote debugging session he will connect to the gdb server. For debugging all commands are sent to the server whow will execute them and send to response back to the gdb debugger.
The snap daemon (snapd) provides the gdb server as buildin tool.
Important
The application has to stop on startup so that the gdb server can attach to the running process.
For more informations about using gdb and gdb server in snap environment see https://snapcraft.io/docs/using-gdb-gdbserver.
'Debugging with GDB' provides general informations about this debugging tool:https://sourceware.org/gdb/current/onlinedocs/gdb/
Overview
This overview will give you a short explenation how remote debugging of a C++ snap application will work. A detailed description will follow in the next chapters.
These are the basics points:
- Your C++ code has to raise a SIGSTOP signal in debug mode. This is done typically in the startup sequence or somewhere else where needed.
- You have to build your C++ snap in debug mode and install it on your ctrlX CORE.
- The snap application will be restarted manually via ssh with the command
sudo snap run --experimental-gdbserver=:12345 <Snapname>.<Appname> - The execution of the application will stop when the SIGSTOP signal is raised so that the gdb server is able to connect.
- From your build environment the gdb debugger is started in remote mode. Provided with IP address and port nummber he can communicate with the gdb server on the ctrlX CORE.
- Now the debug process can be started using gdb debugger commands. Normally this is done from an IDE like VisualStudio Code.
Prerequisites
In the following chapters configuration and starting C++ snap application debugging is explained assuming that Visual Studio Code is used as IDE.
Furthermore we assume that a hardware based ctrlX CORE (aarch64) with the IP address 192.168.1.1 is used and that there is an user with the name rootsshuser installed whow has root and ssh permissions.
Prerequisites for the ctrlX
- Snapd > 2.46.1
- User
rootsshuserwith root and ssh access to the device.
Prerequisites for the Linux Build Environment
- Package gdb-multiarch installed, if not enter
sudo apt-get install -y gdb-multiarch - Copy public key id_sa.pub to ctrlX CORE:
ssh-copy-id rootsshuser@192.168.1.1 - Download and extract the SDK zip archive
Getting Started
The code and configuration examples are from the SDK sample in samples-cpp/datalayer.register.node
So start Visual Studio Code, connect to your build enviroment and open this folder.
Raising SIGSTOP in the C++ Code
In main.cpp at the beginning of the 'int main()' function the code for raising the SIGSTOP signal is placed. The code is only compiled in debug mode:
    #ifdef MY_DEBUG
        std::cout << "Starting 'raise(SIGSTOP)', waiting for debugger.." << std::endl;
        raise(SIGSTOP);
        std::cout << "Debugger connected, continuing program..." << std::endl;
    #endif
Build the Debug Snap
- Select the Visual Studio Code extension CMake in the sidebar. At the top of the explorer window click on '...' (Views and more actions) and select 'Clean all Projects'.
- In the status bar at the bottom of the Visual Studio Code window click on the CMake field and select 'Debug' as build variant in the options drop box.
- In the main menu click 'Run Build Task' and select the CMake Build Kit (compiler). For our ctrlX CORE select 'GCC for aarch64...'. The build will start and create a debug mode snap 'registernode_..._arm64.snap'.
- Right click this file and select 'Download...'
Install the Debug Snap
Install the debug snap on your ctrlX CORE. The application will be started but stops immediately because of raising the SIGSTOP signal at the beginning of the main function.
Configuring Remote Debugging in VisualStudio Code
From Visual Studio Code we want to start the application with the snap run command.
For this the file tasks.json contains the task Launch Remote GDB Server
    {
      "label": "Launch Remote GDB Server",
      "type": "shell",
      "problemMatcher": "$gcc",
      "command": "ssh ${input:Root-User}@${input:Target-IP}  \"sudo snap run --experimental-gdbserver=:12345 registernode.registerNode\" ",
    }
The tag 'command' starts the application under the gdb server via ssh.
As second action we want to start the gdb debugger in remote mode so that he connects to the remote gdb server. Therefor in launch.json the configuration set aarch64 ctrlX (remote) is stored.
    {
        "name": "aarch64 ctrlX (remote)",
        "type": "cppdbg",
        "request": "launch",
        "program": "${workspaceFolder}/generated/ubuntu22-gcc-aarch64/Debug/registerNode",
        "cwd": "${workspaceFolder}",
        "miDebuggerPath": "/usr/bin/gdb-multiarch",
        "miDebuggerServerAddress": "192.168.1.1:12345",
        "stopAtEntry": true,
        "targetArchitecture": "arm64",
        "externalConsole": false,
        "MIMode": "gdb",
        "setupCommands": [
            {
                "description": "Enable pretty-printing for gdb",
                "text": "-enable-pretty-printing",
                "ignoreFailures": true
            },
        ]
    }
The tag 'miDebuggerPath' select gdb-multiarch as debugger, 'miDebuggerServerAddress' set IP address and port number to connect to the remote gdb server.
Starting the Application with VisualStudio Code
Select Main menu item Terminal --> Run Task... --> Launch GDB-Server
In the Terminal window a wellcome message will appear:
    Welcome to "snap run --gdbserver".
    You are right before your application is run.
    Please open a different terminal and run:

    gdb -ex="target remote :12345" -ex=continue -ex="signal SIGCONT"
    (gdb) continue
or use your favorite gdb frontend and connect to :12345
The gdb server has started the application which stops because of SIGSTOP. We are ready to connect with the gdb debugger.
Start Snap Debugging with the Visual Studio Code
Important
Attaching to the snap application succeeds only when there are no breakpoints active!
- Select main menu Run --> Remove All Breakpoints
- Select the 'Run and Debug' icon in the extension side bar.
- Select 'aarch64 ctrlX' in the top line of the explorer window
- Click the green start icon
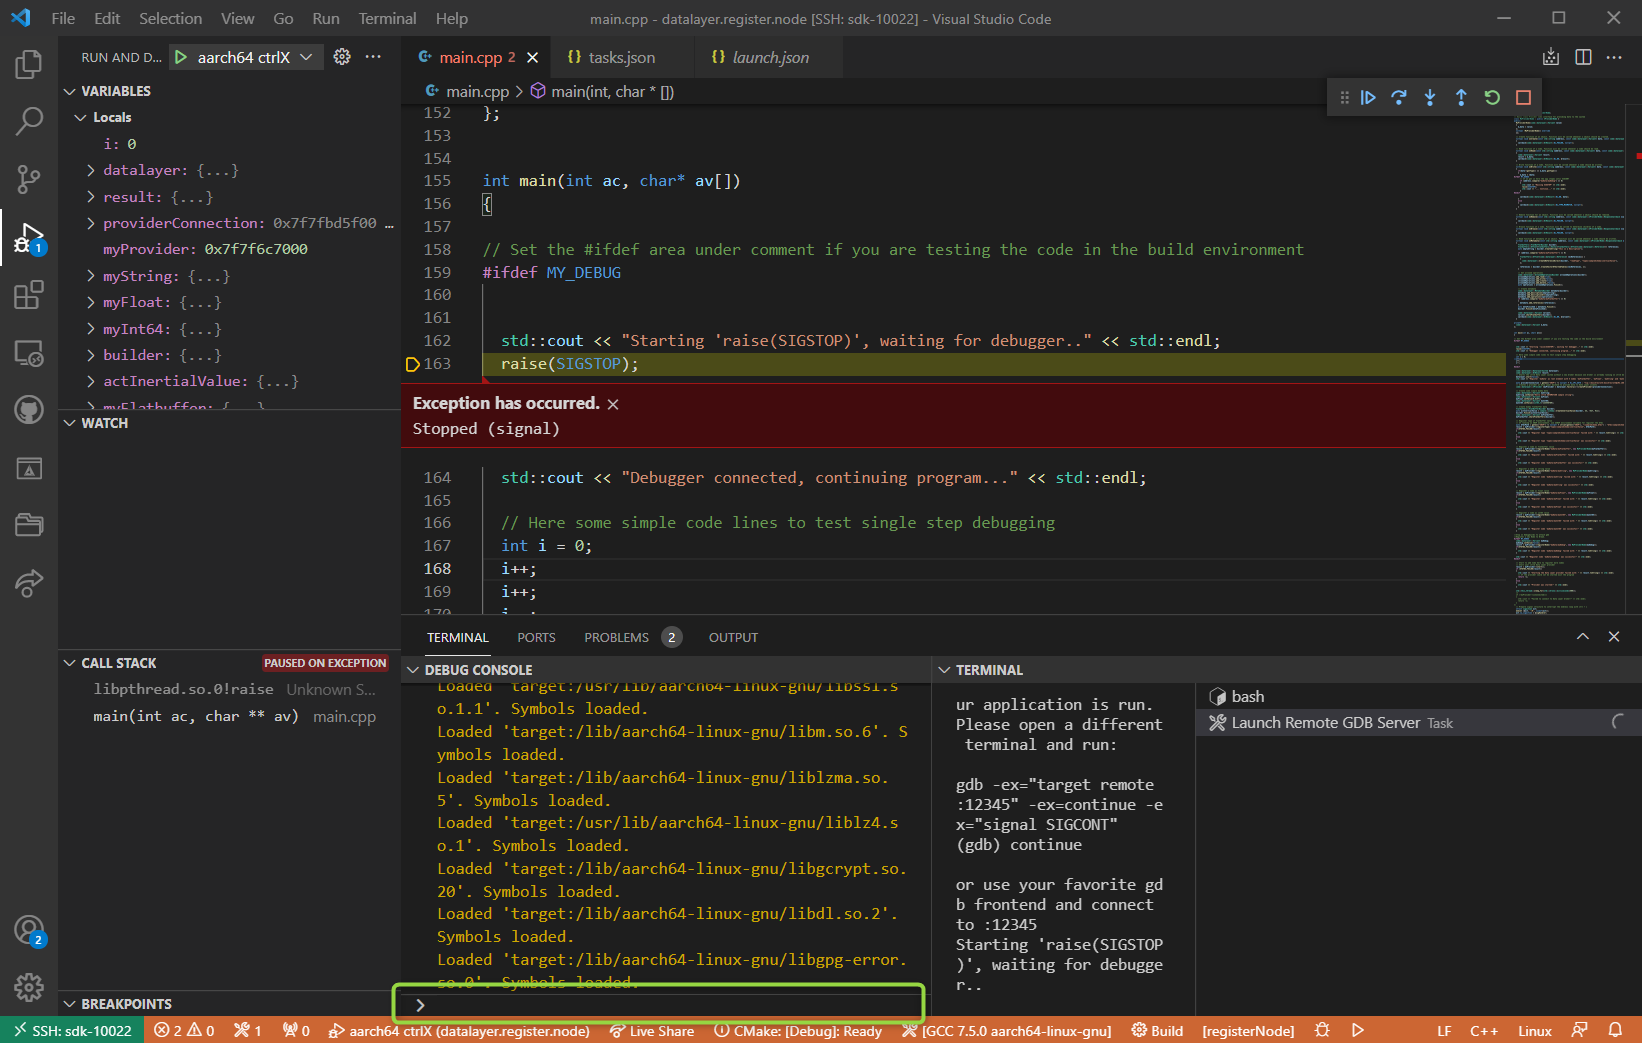
Now gdb is started and connected to the gdb server. With the DEBUG CONSOLE window Visual Studio Code provides an output area and a command line to enter gdb commands - see green area in picture below.
- Click into the gdb command line (green area in the picture above) and enter
-exec info b - All active breakpoints are listed. Each breakpoint has an number (see cloumn 'Num')
- Delete all listed breakpoints specified by their number, beginning with 1:
-exec delete 1 - Ensure with
-exec info bthat no breakpoints are set. - Press F5 (Start/Continue Debugging) several times until in the output area of the DEBUG CONSOLE the loaded libraries are listed and the yellow debug arrow points to the 'raise(SIGSTOP)' line.
Now you can add further breakpoints and continue debugging in the known way.
Screenshots