Debugging Snaps
Overview
In general there are three different ways to debug. Here is an overview of the different types of debugging:
| # | Description | Usage | Disadvanges |
|---|---|---|---|
| 1 | Snap Logs output in terminal and logbook |
|
|
| 2 | Debugging in Build Environment + Connection to ctrlX Data Layer via TCP |
|
|
| 3 | Remote Debugging |
|
|
We recommend to test your application extensively in the build environment (type #2). Testing an application running in it's confined Ubuntu Core snap enviroment can be done by looking at the snap logs (type #1). Remote Debugging (type #3) while the snap is running in the confined Ubuntu Core snap environment of a ctrlX CORE should only be used as the last step, if the other two debug types don't help to debug your application.
Common and important information about debugging snaps are provided by snapcraft: Debugging snaps
In the following you can see how to set up the three different types of debugging.
1. Snap Logs
First build the snap using the right build-snap script and install it on a ctrlX CORE or ctrlX COREvirtual.
You can see the snaps logs in the Diagnostics Logbook on the webpage of the ctrlX CORE or in the console. To see them in the console you need to log in via ssh to the ctrlX CORE. To enable ssh on your ctrlX CORE you would need an system user with extended rights on the ctrlX CORE.
Command
The log output of a snap can be checked with sudo snap logs -f snapname in the console.
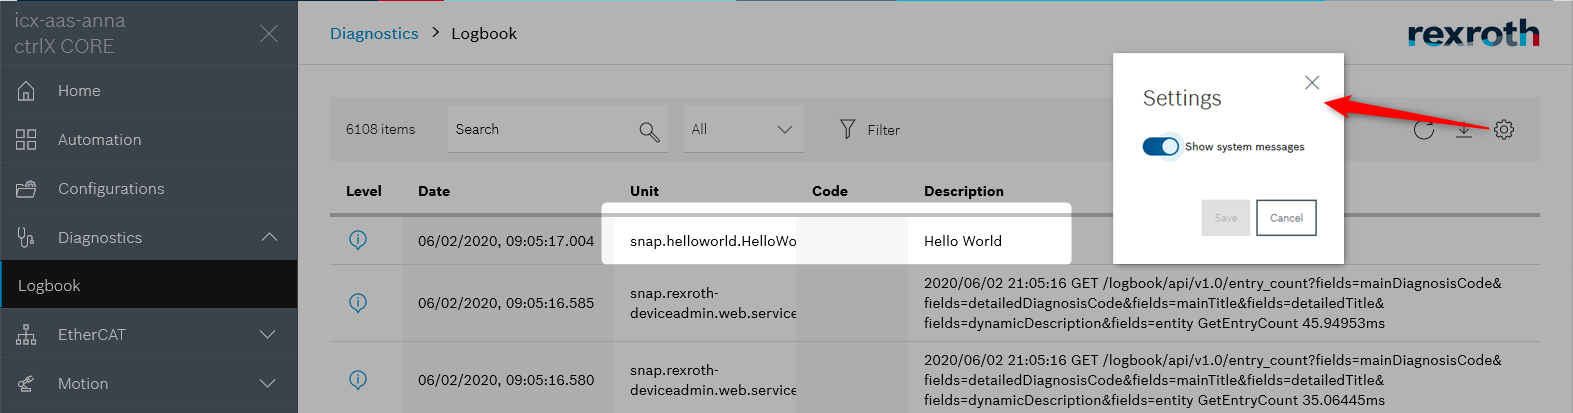
To see the same output of the snap logs in the Diagnostics/Logbook on the ctrlX CORE no system User is needed. Just enable to "Show System Messages" in the settings of the logbook.
2. Debugging in Build Environment
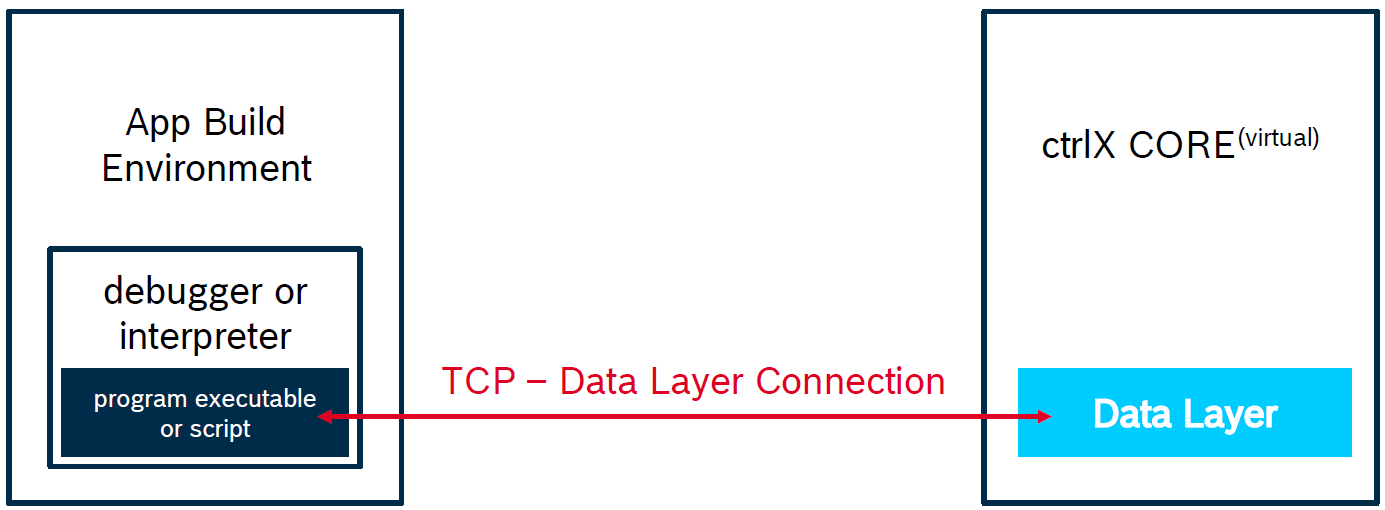
It's recommended to debug your application in your app build environment. You can run script files directly in your build environment with an interpreter (e.g. Python) or run compiled executables with an Debugger (e.g. C++).
The samples in the SDK already contain a launch.json in the folder .vscode, which makes it easy for you to debug the samples using Visual Studio Code as your source code editor.
For the prerequisites for every programming language please see the corresponding documentation in Samples.
3. Remote Debugging
Remote Debugging should only be used as the last step, if the other two debug types don't help to debug your application. For detailed information on this debugging, please see the following descriptions:
-
For C++: Remote Debugging C++ Snaps
-
For Python: Remote Debugging Python Snaps